 What is CAD Data? CAD data can encompass model geometry, derived geometry, metadata, and can extend to data generated from various forms of analysis.
CAD data can be 2D or 3D, composed of wireframes, surfaces or solids, and represented by polygons or voxels.
CAD data can contain underlying spline or analytical geometry, gaps between faces, and formats can be ASCII or binary.
It can contain PMI and UDA data, and can output that data to sharable formats such as 3D PDF and WebGL for anyone to view in a 3D viewer.
It can be extracted to XML and other formats for analysis to help designers and manufacturers improve products and processes.
2D CAD Data
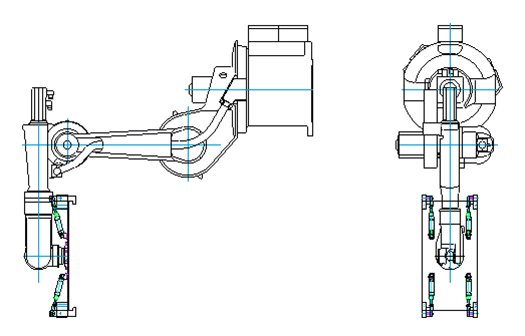
Figure 1 – 2D design data often consists of two or more orthographic views of a part or assembly.
This CAD data is fading in popularity but is still used, primarily with CAD systems like AutoCAD. It consists of lines, arcs, text, 2D splines and ‘blocks’ or symbols which represent parts, tooling or systems (see Figure 1). Generally it can include orthographic views of the front, right side, top, bottom and isometric views of geometry. The 2D views of 3D objects often include dimensions, notes and Geometric Dimensioning and Tolerancing (GD&T) information which can be dictate the precision to which the parts should be manufactured. In some cases 2D views of 3D geometry can be difficult to lay out properly and difficult to understand, leading to downstream manufacturing errors and increased scrap.
3D CAD Models with 2D Drawings
Sometimes the CAD model is 3D, and it is accompanied by a 2D drawing – the 2D drawing includes all dimensions, notes, sections, and can also include GD&T (see Figure 2). This became a standard way of working for many users of products like Pro/Engineer and SOLIDWORKS in the 90s. The generation of the parametric 3D model made it possible to quickly and semi-automatically generate orthographic and isometric drawing views, and the detailed information was added to the drawings. The problem with this hybrid 2D & 3D approach is that if the 2D drawing is not tied to the 3D geometry, the two can become out of sync; the part can be updated, yet the drawing still reflects older information, or vice versa. This can also happen with CAD systems that have part-drawing associativity if the associativity is lost, or if the CAD data is translated to another format (which destroys associativity).
3D CAD Data
3D CAD Data can consist of wireframe geometry, surface geometry, solid geometry, or some combination of the above. When CAD systems first began, wireframe geometry was quite common, but today it is rarely used. In the 80s and 90s, there was a lot of surface geometry in the MCAD world. Surface geometry had the advantage of being able to describe almost any shape, but it was hard to edit and work with. In the late 80s, CAD systems capable of using dimensions to drive geometry in a wide range of shapes started showing up, and within two decades this was the standard approach to most CAD modeling.
Solids
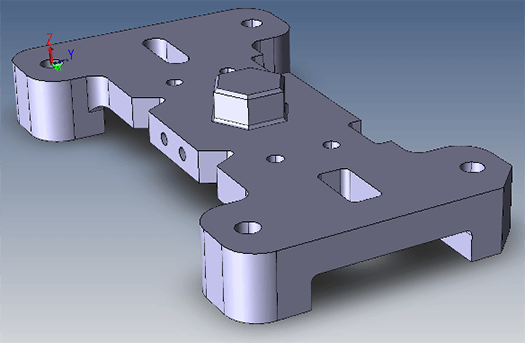
Figure 2 – 3D Solid Models are becoming the norm in the CAD world.
Solid models are ideal for CAD operations because they give you so much information and they’re easy to work with. Solids show up as single parts in your CAD application, so they are easier to manipulate and assemble.
They also give you mass properties, surface area and bounding box information, are easily dimensioned, and can carry PMI information, just to mention a few of their advantages.
Figure 2 shows a typical solid model.
MBD and PMI Data
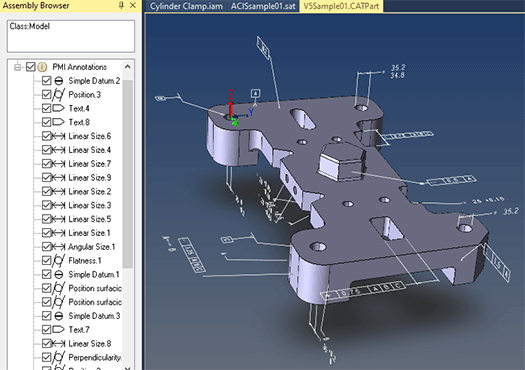
Figure 3 – A key component of MBD is PMI, visible on the part and in the assembly browser.
Model Based Design (MBD) is a method of tying dimensions, notes and Geometric Dimensioning and Tolerancing (GD&T) to the actual 3D solid model rather than keeping that data with the 2D drawing. This facet of MBD is called Product and Manufacturing Information (PMI).
Figure 3 shows PMI attached to the 3D model as well as in the browser on the left. Keeping the dimensions, notes and GD&T with the 3D part improves clarity for designers, engineers and manufacturers, because there are no tricky 2D views of 3D parts to create or understand, there is no danger of the part and the drawing going out of sync, and there is no doubt as to where each notation is attached.
User Defined Attributes
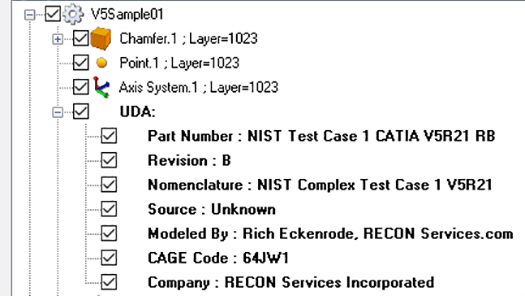
Figure 4 – User Defined Attributes can be almost any information the user wants to include at the time of authoring the CAD file.
User-Defined Attributes are notes and values that can be added by the user at the time the CAD file is created.
In the example in Figure 4, User Defined Attributes include part number, revision, nomenclature, source, author, code and company. UDA is primarily used for identifying models and assemblies.
Feature-Based Modeling
With the advent of feature-based modeling in the the late 80s, it became possible to define a sketch with dimensions, and then extrude or revolve that sketch to create solid geometry. Both the sketch and the extrusion could later be edited by simply double-clicking on that ‘feature’. Although this system had and has many advantages such as ease of edit, it can also allow a person to paint themselves into a corner, limiting the flexibility of the design process. Another disadvantage of feature-based modeling is that when you import a CAD model from another system, you cannot edit the features. The inflexibilities of feature-based modeling created demand for a new way to edit existing geometry called Direct Modeling.
Direct Modeling
Direct modeling allows users to directly select the geometry they want to edit, and drag the geometry position and move it or otherwise adjust it. Direct modeling is especially useful if the geometry has been translated from the original CAD system to another CAD system, and the ‘features’ have been lost. There are CAD systems that can perform both feature-based modeling and at least some elements of direct modeling, such as SOLIDWORKS, Solid Edge, Creo Direct and Inventor.
Sheet Bodies
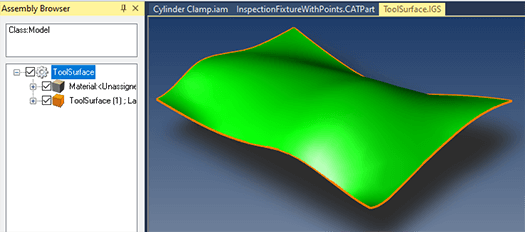
Figure 5 – Sheet bodies have no thickness or volume.
These are zero-thickness surfaces which have no ‘volume’.
Sheet bodies are often used in the automotive industry for defining shapes to be stamped into metal, forming sections of auto bodies. An example of a sheet body is shown in Figure 5.
Surfaces
Surfaces can describe complex shapes, but they can be difficult to work with, and they do not give you the in-depth information that solid models do, such as mass, volume, surface area, bounding box areas, etc. Many CAD applications require a waterproof solid model in order to function well.
Wireframe Geometry
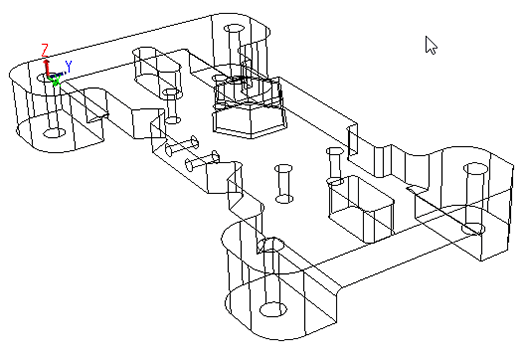
Figure 6 – A 3D wireframe has no surfaces and no enclosed volume.
Wireframe geometry is the structure or skeleton of a solid model, without the surfaces, and without the enclosed volume.
Wireframes were common in the CAD applications of the 70s and 80s, but are rarely seen today, unless you are using an older CAD application that relies on 3D wireframes.
Figure 6 shows a wireframe model that was generated from a solid model by saving out to the IGES format and turning off surface generation in the IGES Write settings. All major 3D CAD systems also allow you to view solid models as wireframes, which can be helpful when you need to see inside the model, or perform repairs.
Polygonal Representation
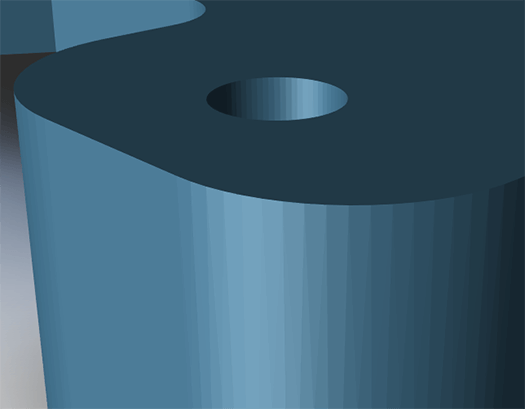
Figure 7 – Polygonal models are faceted representations of CAD models.
CAD geometry can be representated with polygons, or ‘faceted models’ for various applications such as art & entertainment, virtual and augmented reality, and additive manufacturing (also called 3D printing).
Polygonal representation of solid models is never exact, because the solid model is an exact representation, and a polygonal model is a faceted approximation of a solid model. Polygonal models are by definition composed of polygons – flat faces – so any curved faces in a CAD model have to be converted to an approximation of a curved face. See Figure 7.
Voxel Representation
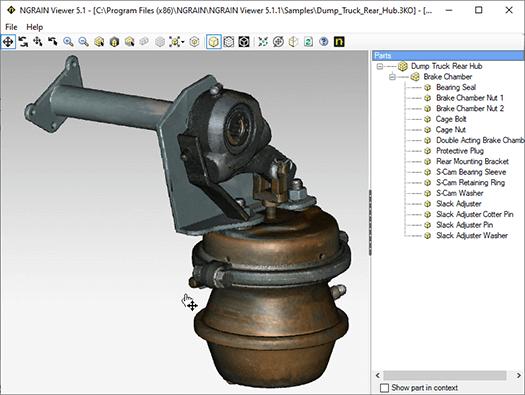
Figure 8 – Voxels are like 3D pixels and are useful for viewing large assemblies.
Voxels are like 3D pixels; most people know that pixels are ‘dots’ that define an image. Voxels are 3D ‘dots’ that define a model. The more voxels, the more defined the model.
Voxels are useful for visualizing large models and assemblies quickly. A popular Voxel format is NGRAINs 3KO. If you need to view one of NGRAIN’s voxel files, you can do so with the free NGRAIN viewer; just google NGRAIN Viewer (see Figure 8).
NGRAIN and voxels can also be used to build assembly, disassembly and maintenance animations for field personnel to watch on tablets.
NURBS
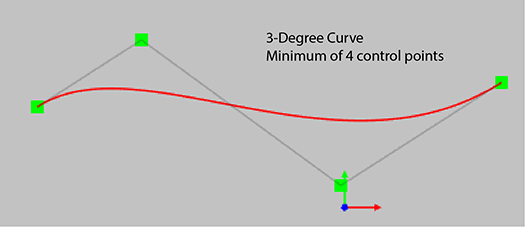
Figure 9 – NURBS curves can efficiently describe analytic geometry as well as modeled geometry.
NURBS stands for Non-Rational B-Spline, or Non-Rational Basis Spline. NURBS are a mathematical model that can approximate analytic geometry such as cones, cylinders, spheres and planes, as well as modeled geometry; which is the issue with splines in general – they’re always approximations of geometry as opposed to ‘closed loop’ analytic equations.
Figure 9 shows a 3-degree NURBS curve. The curve is manipulated by moving control points (shown in green in this example). A NURBS curve will always have one more control point than the degree of the curve. A 1-degree NURBS curve would be a line with two points, for example. NURBS curves are the foundation of NURBS surfaces, which are defined by control points in U and V directions.
Splines vs Analytic Geometry
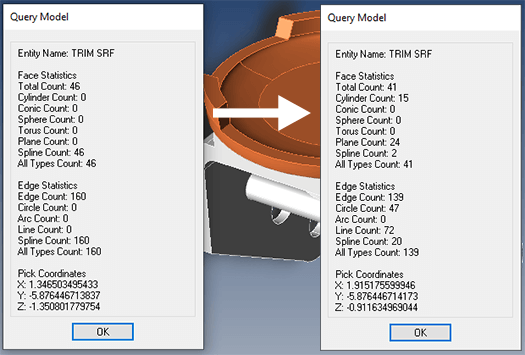
Figure 10 – Analytic geometry has more information and is more accurate than spline geometry.
The easiest, yet least effective way to translate a CAD model is to convert all geometry to splines (B-Splines, NURBS, NUBs and T-Splines). STEP translators allow so much latitude in how they are written, there are a lot of spline-heavy STEP translators out there, mucking up CAD data.
In Figure 10 at right, you can see an IGES part that has the entity types listed for the lower, gray component. The listing on the left is before Lite Repair was run the second time, and the listing on the right is what the entity list looks like after Lite Repair.
This geometry was improved by replacing face and edge geometry from spline approximations to analytic geometry – from 46 spline faces to 2 spline faces, and from 160 spline edges to 2 spline edges, to lines, arcs, planes, spheres, cones, toruses and cylinders. These entity types are more compatible with downstream CAD processes such as machining which expect a hole to be described as a cylinder, and expect a face to be described as a plane.
Tolerant Edges
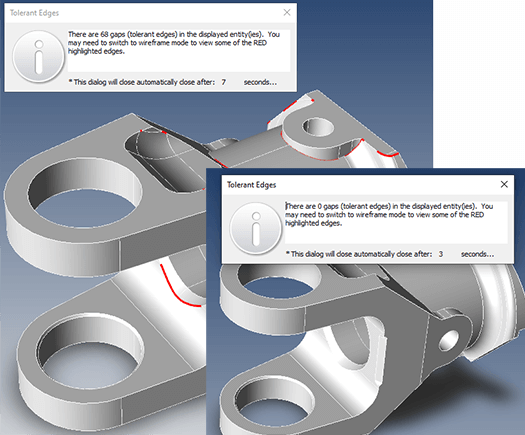
Figure 11 – Tolerant Edges are areas where there are very small and not necessarily problematic gaps between surfaces.
Tolerant edges are areas where the gap between surfaces is greater than 10-6 precision of TransMagic; tolerant edges do not mean that the geometry is necessarily bad. That depends on the precision of the application that will receive the CAD file; if the gaps are bigger than the tolerance of the destination CAD application, it could lead to problems stitching the surfaces together into a solid model, or could lead to missing faces.
In Figure 11, the first analysis found 68 tolerant edges, and then, after TransMagic’s Lite Repair was run a second time, tolerant edges were brought down to 0. Tolerant edges cannot always be completely removed, but even eliminating some of them can help ensure better geometry in downstream CAD applications.
Assembly Hierarchy
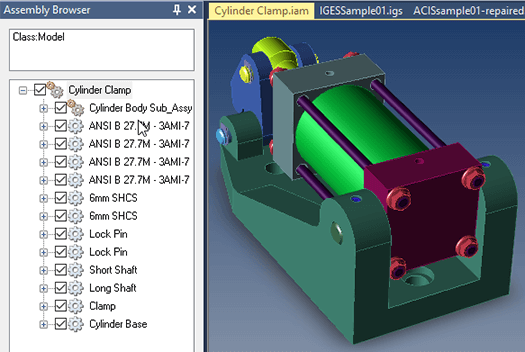
Figure 12 – The assembly hierarchy shows the parts and subassemblies that make up the main assembly.
Assemblies have a hierarchy which can be viewed in CAD systems and some CAD viewers and applications.
This hierarchy shows you the list of parts and subassemblies in the main assembly, and can also include PMI data and User Defined Data. In some cases the assembly hierarchy can also be viewed in derived 3D PDF, Collada and other non-CAD formats.
In Figure 12, the double gear icon designates that this is an assembly, and the single gear icons represent parts. There is a subassembly visible at the top of the assembly browser. In this assembly browser it is possible to click on an object and it will zoom to that object in the screen area.
Flattened Assemblies
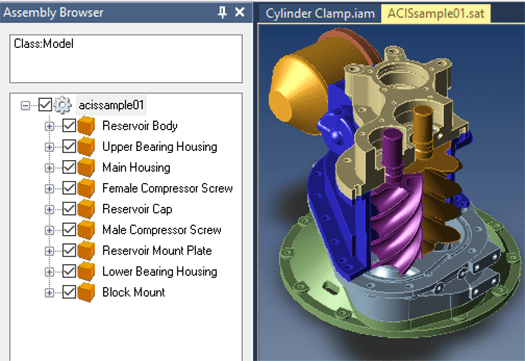
Figure 13 – A flattened assembly is a single part made up of two or more solid bodies.
An assembly can be ‘flattened’ so that the entire assembly is a part, and all the former parts become ‘solid bodies’.
This can be important if the target CAD application only reads part geometry. Conversely, flattened assemblies can be converted to true assemblies by turning solid bodies into parts, and existing parts into assemblies.
Figure 13 shows an example of a flattened assembly. The single gear icon represents a part, and the orange cubes represent solid bodies.
Assembly Mates
Almost all modern CAD systems have assembly mates, but assembly mates do not usually translate to other CAD formats; instead, what you get will be the assembly with the parts positioned properly, but there are no constraints on the movement of the parts.
Instanced Components
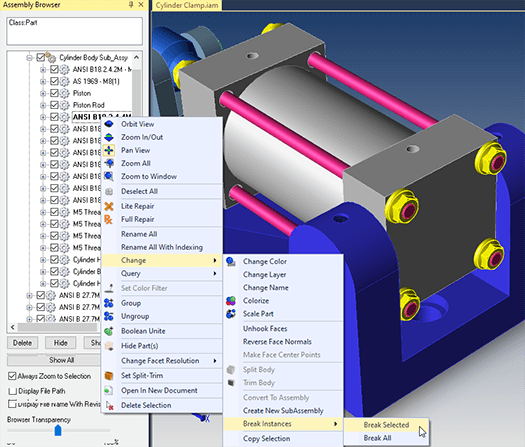
Figure 14 – Instanced components can be broken in order to work with them individually.
When you create a bolt circle or other types of feature arrays in many modern CAD systems and apply fasteners to that pattern, the CAD system often ‘instances’ the bolt geometry because it is faster and more efficient to do so. Instanced geometry only has to be referenced once in the CAD system and subsequent instances are treated as lightweight symbols.
Downstream, instanced geometry can present a problem if you want to delete or move one bolt but keep the other five for any reason.
Advanced translation and viewing tools can allow you to break a single instance, or all instances so that you will have access to these components later to move them around, delete individual instances, change color, etc. (see Figure 14).
Origin, UCS and WCS
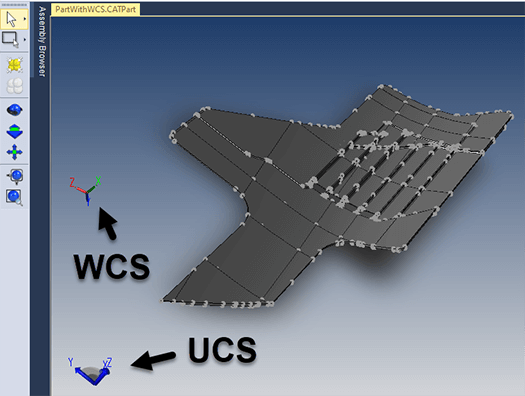
Figure 15 – Different coordinate systems are common in CAD data.
Every CAD system has an origin point, and positive and negative X, Y and Z directions. These can sometimes become important when trying to put components together, or to position scanned points relative to the original CAD geometry. The default origin and orientation for the part is called the User Coordinate System (UCS), and every part has one.
Some translation issues between different CAD systems and formats stem from different coordinate systems being used or implied by the different systems.
A Working Coordinate System (WCS) is sometimes used to define a new origin and orientation for a part, distinct from the UCS. A WCS can be particularly helpful with CNC machining and with Coordinate Measuring Machines (CMM), because measurements setup and oriented in a way ideal for the part and the equipment. Figure 15 shows a UCS and a WCS example.
ASCII vs Binary CAD Data
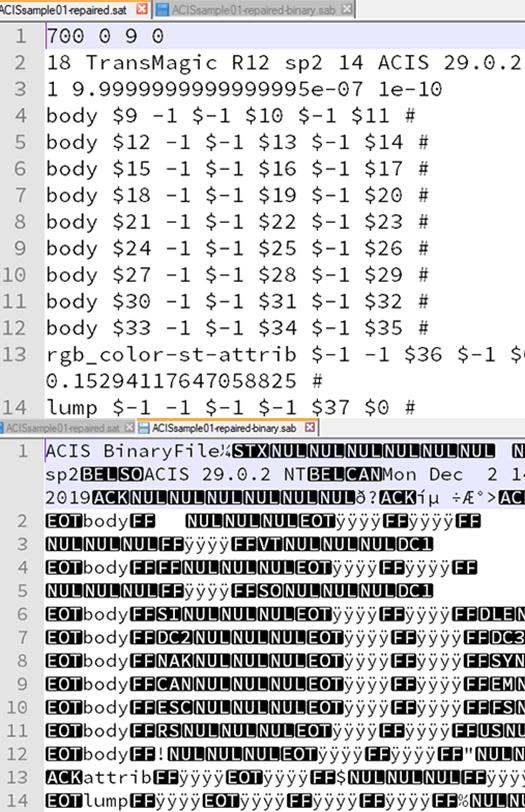
Figure 16 – CAD ASCII formats are ‘human readable’ while binary formats are unreadable.
Several CAD formats such as ACIS can be ascii or binary. ASCII means the format is text-based (and is to some degree human-readable), and binary means the format requires special instructions to decode.
ASCII formats have the advantage of making it easier to spot problems with the file (assuming you are familiar with the CAD format), and binary formats have the advantage of being smaller in size.
Figure 16 shows an example of ASCII vs binary ACIS model code, with the ASCII code on the top and the binary code on the bottom. The geometry of the two files shown is the same, but the binary version is only about 60% of the size of the ASCII version.
DXF is an ASCII version of DWG, and is so easily understandable that it is possible to open the file and make edits to a 2D drawing with a text editor such as Notepad++ and repair or modify a file.
Most 3D models are far too complex to manually edit, but you can sometimes find enough information in the text file to learn what version the file is. See ‘What CAD Format Do I Have Here’ for some examples of this.
Construction Geometry
Geometry that was created for construction purposes can sometimes remain in the CAD file, though sometimes visibility has been turned off. This geometry can include planes, free edges, free vertices, notes or even solid models and surfaces. If your CAD system or viewer has a high level of control, you can determine what kind of geometry you want to work with at the Read stage.
Hidden Geometry
Sometimes the geometry you need to access is there, it’s just off the screen, on a non-visible layer or in a hidden state. It’s also possible that the settings which were present when you opened the file caused all hidden geometry to be discarded. For this reason, start with your settings and make sure that you have all possible geometry set to visible, then check that all geometry is visible in your CAD system, check that all layers are visible, and then zoom extents, since sometimes the geometry you’re looking for is there, it’s just off the screen.
Part Name Extraction
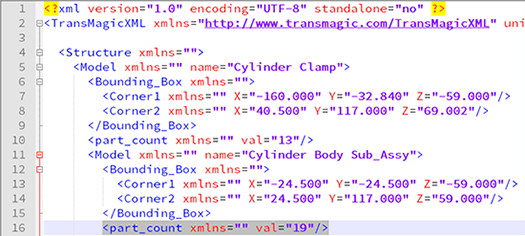
Figure 17 – Part names and counts can be extracted to XML for BOMs and parts lists.
CAD data can be extracted from parts and assemblies for analysis as well as bills of materials or parts lists.
Figure 17 shows an assembly level item on line 5 – Cylinder Clamp; that’s the name of this assembly. On line 11, the first component is a subassembly ‘Cylinder Body Sub_Assy’. Each component also includes the approximate location via a bounding box.
PMI Extraction
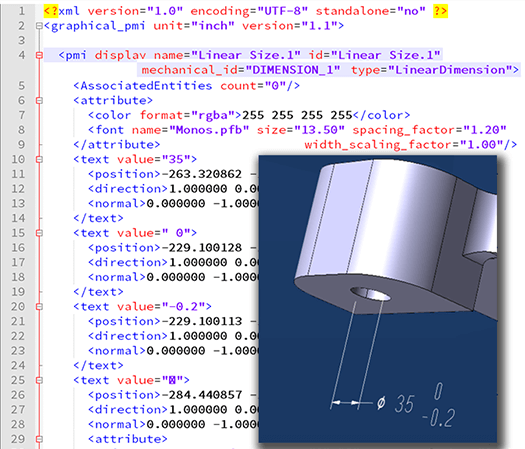
Figure 18 – PMI Data Extraction to XML.
PMI data can also be extracted from parts or assemblies for processing.
Each notation is defined by a unique identifier, and the GD&T symbology as well as plus and minus tolerances are all included in the XML output.
In Figure 13, the name of the dimension is on line 4, the size of the dimension is given on line 10, the plus value is on line 15 and the minus value is on line 20, with the symbol (diameter in this case) on line 25.
This data could be useful for downstream product and process analysis of machining tolerances, tolerance stackups, fits and manufacturing optimization. Figure 18 shows the hole tolerance values with an inset of the actual hole being defined.
Mass Properties Extraction
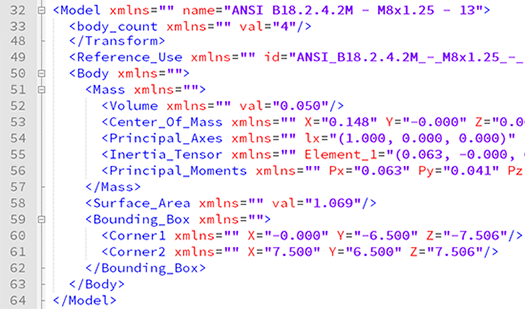
Figure 19 – Mass properties data extraction including mass, volume, surface area and bounding boxes.
Mass properties including mass, volume, centriod and moments of initeria can be extracted from CAD models and assemblies, as can related properties such as surface area and bounding box information for all components.
Figure 19 shows an example of mass properties extraction; on line 32 is the name of the component, volume on line 52, center of mass on line 53, surface area on line 58 and bounding box extents on lines 60 and 61.
These values can be used to generate estimates for paint, coatings, surface treatments, material needs, packaging sizes, shipping costs and related information.
View CAD Data via 3D PDF

Figure 20 – 3D PDF files are a great way to share CAD data.
Not every project stakeholder has access to a CAD system or even a CAD viewer. To make sure everyone on the team has access to CAD data, you can share a 3D PDF with them. The only thing necessary to view a 3D PDF file is Adobe Acrobat.
3D PDFs allow you to rotate, zoom and pan the part, view the assembly hierarchy, and can also show all PMI and PMI views.
In Figure 20, the CAD model with PMI attached is visible in the screen area, the assembly hierarchy and semantic PMI is viewable on the left side of the image, and just beneath that, you can see four PMI views which were extracted from the original CAD model. If you click on any of these views, they automaticaly populate in the screen area.
Note: You can also use WebGL to view CAD and PMI data. WebGL only requires that the browser be HTML5 compatible, and almost all browsers meet that requirement today.
Product Lifecycle Management (PLM)
PLM systems help companies manage the entire lifecycle of a product, including design, BOM, manufacturing, service and disposal. This is done through the integration of various business systems and processes. CAD data is a small but critical part of the information that is managed to meet customer needs, allocate resources, maintain and recycle products.
Enterprise Resource Management (ERP)
ERP systems allow organizations to collect, manage and store business resources; this information is shared between purchasing, design, engineering, manufacturing, accounting and sales departments. CAD data is a key component of the ERP system.
Revision Analysis
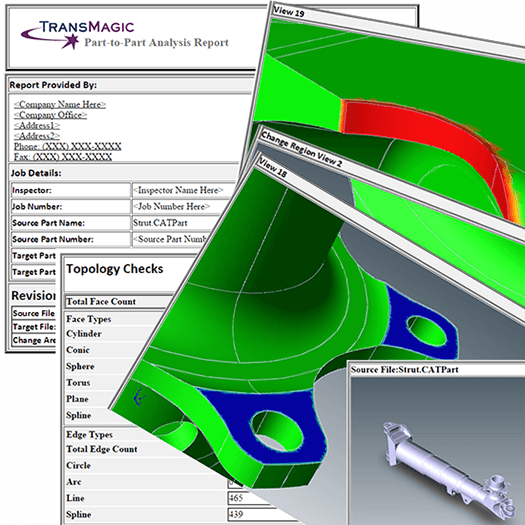
Figure 21 – Revision analysis tells you what has changed and where it has changed.
A comparison between an original CAD model and a revision, or between revisions, indicating by heat map or other means where and to what degree revisions have occurred to geometry or other CAD data.
Revision analysis is especially important because it is often the case that customers neglect to mention all modifications to a design. If some changes go undetected, the supplier or estimator could be liable for incorrect dimensions, fits, or other downstream manufacturing issues.
Revision analysis takes the guesswork out of revision checking; many companies still use the brute-force method of looking at two overlaid models to see if there are undocumented changes, but they risk missing small changes or changes inside of the part. In Figure 21, you can see a report detailing the changes between two revisions.
Validation Analysis
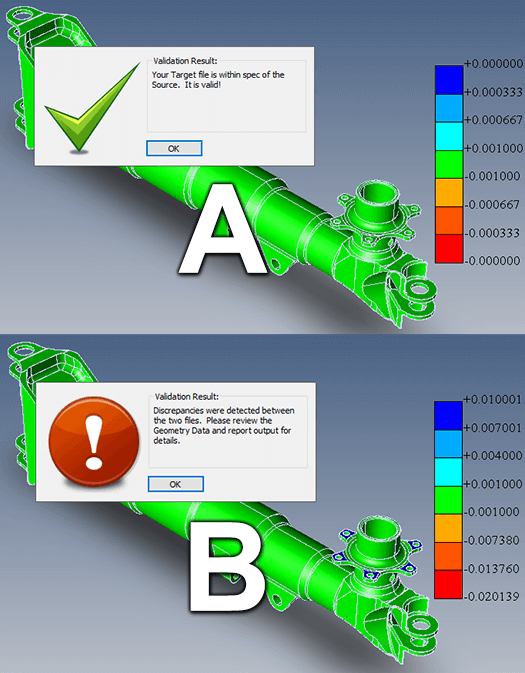
Figure 22 – Validation analysis checks if the derived CAD model is within tolerance of the authority CAD model.
Validation analysis is sometimes required when working with aerospace companies such as Boeing, to ensure that suppliers are working with CAD data which has not changed significantly from the original CATIA CAD data.
Suppliers are allowed to convert the CAD data to the format of their choice in order to perform their design or manufacturing tasks, but need to demonstrate via validation analysis that the geometry is within a specified tolerance of the original geometry.
Boeing Spec D6-51991 specifies that aerospace components need to be within a tolerance to the original CATIA part geometry, regardless of the format it was converted to.
AS9100 (Aerospace Standard 9100) also states that products must be verified, validated, measured, monitored and inspected. Validation Analysis is one way to verify that the geometry is valid.
Figure 20 shows an example where the geometry passed validation analysis (A), and where it failed (B). Note that in image B, some of the part features are colored to indicate that they are outside of the original part envelope by a value greater than the allowable tolerance.
If derived CAD data is out of tolerance, it can affect downstream manufacturing, production and safety.
Point to Part Analysis
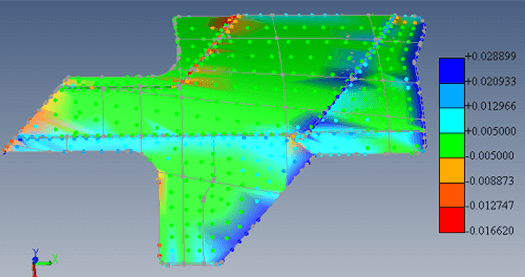
Figure 23 – Point to Part Analysis checks how close each scanned or measured point is to the original CAD model.
Prototype and production geometry is measured using Coordinate Measuring Machines (CMM) or scanning technology, and the points generated are compared to the original authority CAD model to see if they are within tolerance.
This analysis helps design and manufacturing teams tweak values of the original model or manufacturing processes in order to get the final product specs right.
In Figure 23, bluish colors indicate points that are outside of the original CAD model envelope, and reddish values indicate areas that are inside of the original part envelope. Green areas are within the specified tolerance (0.005 in this case) of the original CAD model.
Bill of Materials (BOM)
A list of parts, subassemblies and materials necessary to manufacture any given product; but in the case of complex products like cars, master BOMs for any given vehicle can contain sub-BOMs for the engine, transmission, body, suspension, dashboard and for every major sub-component. In some cases there can be engineering BOMs which are converted to manufacturing BOMs, and managed by the ERP system.
Product Data Management (PDM)
The software industry uses ‘version control’ to make sure they are using the latest version of programs, scripts and assets. PDM performs similar tasks for the CAD industry, helping teams track the correct CAD files, names, part numbers, configurations, cost, quantities and suppliers, a way to track non-secure data and Intellectual Property (IP) risk and serves as a system to track product and process history.
TransMagic Gives You Access to More CAD Data
- TransMagic gives you access to read and write more CAD formats, and different, often better translators for the same formats you currently use.
- Read surfaces and automatically stitch them into watertight solids.
- View and manage PMI data.
- Write CAD geometry and PMI to 3D PDF and share it with all project stakeholders, whether they have access to a CAD viewer or not.
- Optimize and write polygonal representation including STL, OBJ, 3D PDF, WebGL.
- Create NGRAIN Voxel files for viewing large assemblies and maintaining equipment.
- Heal tolerant edges and convert spline geometry to analytic geometry for downstream CAD applications.
- Flatten true assemblies and convert flattened assemblies to true assemblies.
- Extract CAD data with TransMagic EXPERT to XML for analysis and report building.
- Perform revision analysis, validation analysis and point to part analysis with TransMagic MagicHeal.
- Test Drive the TransMagic Eval
- Have questions? Give us a call at 303-460-1406.